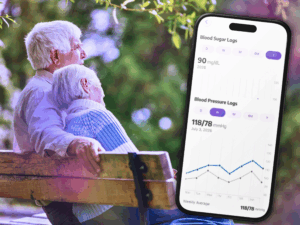
Biomarkers for Longevity: What to Track and How

The question of longevity has become a big part of the health and wellness conversation in recent years: what does it mean, can we measure it, and which habits and protocols are associated with longer, healthier lives. And, of course, it comes from a natural drive – to stay healthy and vital for longer, for ourselves and our families. Researchers, scientists and thought leaders in the field, such as Peter Attia, Andrew Huberman and David Sinclair, have brought the topic of longevity into the mainstream spotlight, and the interest in measuring it has grown with that.
Advances in science and technology have changed what is possible. Blood panels, wearables and home test kits promise to show how well you are ageing, and the list of biomarkers you could track grows every year to the point where it gets overwhelming to follow everything.
The truth is that most of it is not essential. A small set of biomarkers has strong evidence behind it, while the rest are still being studied or useful only in particular situations. What matters more than the number of markers is how you use them: measuring the right things, in the same way, over enough time to see a trend.
This guide covers which biomarkers are worth observing over time for long-term health and how to track the results. It is all individual depending on your age, history, etc. But the set of biomarkers below is generally considered as a good starting point, you can discuss with your health practitioner.
What exactly are biomarkers and what can they tell you about longevity?
A biomarker is a measurable sign of what is happening in your body. The FDA-NIH BEST (Biomarkers, EndpointS, and other Tools) glossary defines it as “a defined characteristic that is measured as an indicator of normal biological processes, pathogenic processes, or biological responses to an exposure or intervention, including therapeutic interventions.” Blood pressure, cholesterol, HbA1c and grip strength are all biomarkers. For longevity, in particular, the useful ones are those linked to the conditions that most often shorten or limit healthy life, such as heart disease, type 2 diabetes, stroke, and to the loss of fitness and muscle strength that comes with age.
Three things to keep in mind when it comes to biomarkers and longevity:
- A biomarker shows risk, not inevitability. A number tells you about the odds, and many of them can be changed. And this is where tracking becomes powerful – in order to change something, you need to see it first.
- Association is not a cause. In a UK Biobank study of nearly 71,000 adults, people with higher fitness and stronger grip had a lower risk of dying over the next 5.7 years on average. The study, along with others, only observed people, so it can’t show that fitness itself caused the difference. Fitter people may also differ in other ways, such as diet, sleep or existing health. So it shows what goes with better health, not always what causes it.
- A trend in the results tells a lot more than a single value. Most markers vary from day to day and from lab to lab. What counts is the direction over months and years.

Which biomarkers are most commonly tracked for longevity?
There is no official “longevity biomarkers” list. The markers below are the ones with the strongest evidence so far, grouped by what they show.
Heart circulation and blood vessels
Blood pressure and blood fats (lipids) are the well-established, long-lasting core of cardiovascular risk assessment.
- Blood Pressure. Raised blood pressure strains the heart over the years, usually without any symptoms. The NHS describes an ideal reading as between 90/60 and 120/80. In the UK, hypertension is generally considered at 140/90 or above in a clinic, or 135/85 or above on home readings. If your doctor asks you to monitor at home, the usual protocol is: two seated readings at least a minute apart, morning and evening, for at least four days. (NICE hypertension guideline)
- Cholesterol and ApoB. The NHS describes total cholesterol, HDL and non-HDL cholesterol and gives a guide for healthy adults of total cholesterol below 5 mmol/L and non-HDL below 4 mmol/L. The standard cholesterol test (LDL-C) measures the cholesterol carried in LDL particles. ApoB counts the particles that can build up in artery walls, because each carries one ApoB molecule. It is sometimes used as an alternative test to LDL-C, especially for people with family history, high triglycerides, diabetes, obesity, metabolic syndrome or very low LDL-C. Targets depend on your age, health conditions and overall risk and your doctor may use these results alongside blood pressure and other factors to estimate your ten-year risk of heart and circulation problems.
- Lipoprotein(a), or Lp(a) is a cholesterol-carrying particle that is largely inherited, and its levels stay generally stable throughout life. Diet and exercise do not change it much, and there is no established treatment to lower it yet. It is usually considered where there is a family history of heart disease, to refine risk.
Blood sugar and metabolic health are other well-established metrics for long-term health:
- HbA1c reflects your average blood sugar over the past two to three months. In the UK, below 42 is considered normal, 42 to 47 mmol/mol (6.0 to 6.4%) suggests risk of diabetes (prediabetes) and 48 mmol/mol (6.5%) or above is the diabetes range. A diagnosis always needs a doctor’s confirmation since the results can be affected by other conditions or medicines, and a high result is usually repeated to confirm it.
- Waist measurement is another factor that is sometimes used as additional context. Where you carry weight matters for metabolic health as well as how much. The NHS says risk increases from 94 cm for men and 80 cm for women, and is high from 102 cm and 88 cm. Thresholds can differ for different ethnic groups.
Fitness and strength
Physical fitness is not a traditional biochemical biomarker (like blood sugar and cholesterol), but is increasingly recognised and studied as a powerful functional health biomarker.
- VO₂ max or Cardiorespiratory fitness. This shows how well your heart, lungs and muscles deliver oxygen during effort. In the UK Biobank study, people in the highest fitness group had about 35% lower all-cause mortality risk than the lowest. A lab test is the most reliable way to measure it. Wearable devices nowadays show estimates that can be off by a margin. However, they can be used to follow your own trend and notice changes if you are working out regularly.
- Grip strength. A hand dynamometer is a quick, inexpensive test of overall muscle strength. In the same study, the highest grip-strength group had a 21% lower all-cause mortality risk. People in the top group for both fitness and grip strength had roughly half the all-cause risk and about a third of the cardiovascular risk of those in the bottom group for both.
Inflammation and organ function
- hs-CRP. This high-sensitivity test picks up low-level inflammation. It is not specific: infections, injuries and even a hard workout can raise it, so a single value can mislead. It is best repeated when you are well and discussed with a doctor.
- Kidney and liver tests. These are often part of routine blood panels. They matter for long-term health and for the safety of medicines.
How to choose what to track and why more tests aren’t better?
It is tempting to think that measuring more will automatically tell you more and help you take better action. In practice, a long list of metrics can create confusion and anxiety without improving your decisions.
A useful health-tracking plan is usually focused. It contains a manageable number of measures, each chosen for a clear reason and linked to a possible action. The right list depends on your age, family history, symptoms, existing conditions and medications.
A sensible way to build your list:
- Start with the basics. Blood pressure, cholesterol, HbA1c, physical fitness and grip strength can provide useful information about cardiovascular health, metabolic health and physical function.
- Add other measures for a specific reason. A symptom, family history, existing condition or recommendation from a healthcare professional may justify tracking an additional biomarker or measure.
- Leave out measures that will not change what you do. Large private testing panels and some biological-age scores can produce interesting numbers, but they may not give you a clear next step. More information is not necessarily more useful if you do not know how to interpret it or act on it.
A healthcare professional can help you decide what is relevant by considering your age, family history, symptoms, existing conditions and medications. These factors determine which results are meaningful for you, not simply the number of tests you take.
For example, the NHS Health Check in England offers a structured starting point for many adults aged 40 to 74 who do not already have certain diagnosed conditions. It typically includes checks such as blood pressure, weight and cholesterol, with diabetes testing when someone is considered at risk. This illustrates an important principle: a focused set of relevant checks can be more useful than testing everything at once.

Why more tests can create more confusion sometimes
Adding tests is not automatically better because reference ranges are designed around populations, not individual certainty.
A typical lab reference range covers the middle 95% of results from a selected healthy population. That means approximately 5% of healthy people may fall outside the range on any single test, even when there is no underlying disease. The more tests you take, the greater the chance that at least one result will appear outside its reference range purely by chance. Under a simplified assumption that 20 test results are independent and each uses a 95% reference range, there is roughly a 64% chance – about six in ten – that at least one result will be flagged.
That does not mean the test is useless or that the result should be ignored. It means an isolated result needs context. Your symptoms, medical history, previous results and follow-up testing matter more than a single flagged number.
The goal is not to measure everything. It is to track the measures that can help you understand your health and make better decisions.
How do you track biomarkers over time?
Consistency is what makes results comparable. A few habits help.
- Use the same lab when you can. Methods and ranges can differ, so comparing results from the same lab is cleaner.
- Record the date and the conditions. Fasting, recent exercise, illness and medicines can all shift results.
- Keep the units alongside the number. A cholesterol of 5 and a cholesterol of 193 can be the same result in different units.
- Note the context. A new medicine, a change in routine or a rough few weeks all help you interpret a shift later.
- Test as often as your clinician advises, not as often as an app suggests. For example, people with diabetes are usually advised to have HbA1c checked every three to six months, while kidney tests follow a schedule set by stage and risk.
How to keep your biomarker tracking in one place with Veraia?

When we think about longevity, it is not the single test that gives us empowering, useful information. Results rarely stay together. You will later have to look for them in folders, patient portals, wearable apps, PDFs from private clinics, screenshots. Units differ, reference ranges differ and when it’s time to compare results with the ones from last year, you are not sure where to find them.
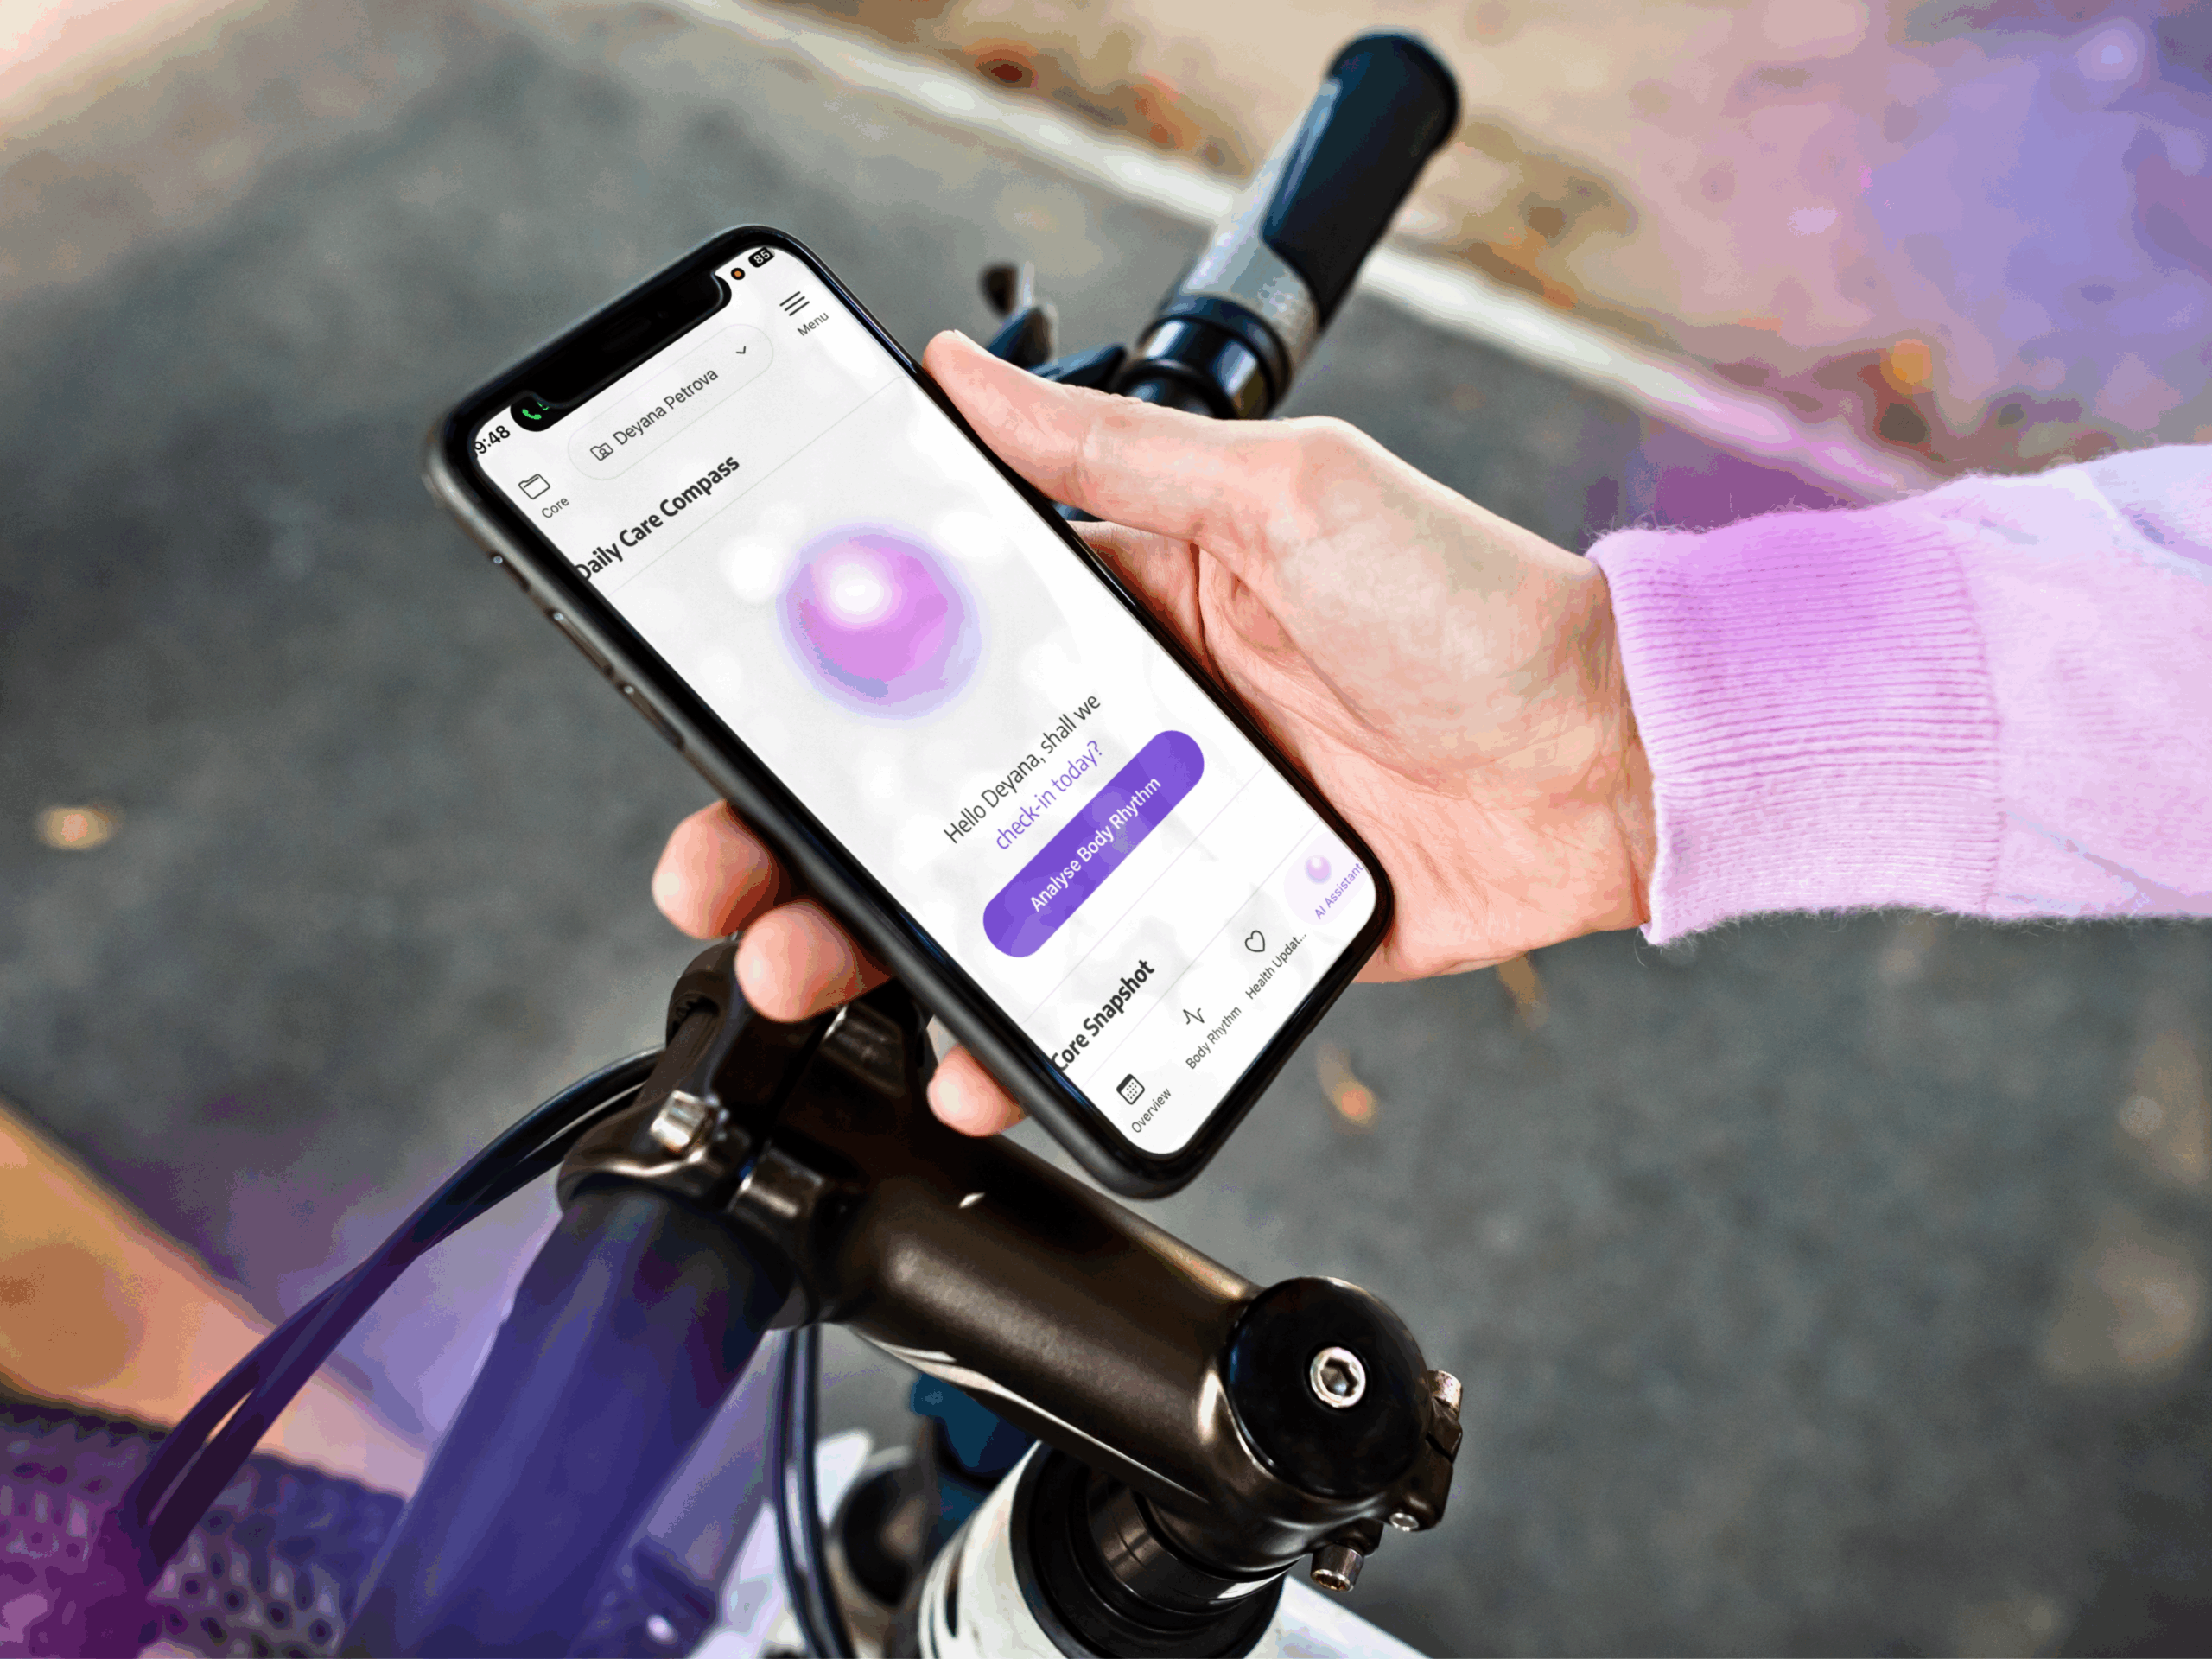
Veraia was built to keep the continuity in your tracking. It is an AI health assistant for iOS that keeps your health information in one place. In your Core, your complete health profile on Veraia, you keep your conditions, medications, allergies and test results on one chronological timeline, so a result always sits next to the ones before it and next to what was happening in your life at the time.
Body Rhythm is your daily log, where you can note symptoms, wellbeing and home readings such as blood pressure. Veraia Observations looks across what you have recorded and brings forward slow-building patterns. It can also point out when a reading sits above the reference range printed on your report, with a note that it may be worth mentioning at your next appointment.
You do not need a hundred biomarkers to track your long-term health. A small number of well-chosen measures, taken consistently and followed over time, can tell you more than a single large testing panel. Start with a baseline, record the units and context for every result, review your measurements at appropriate intervals and discuss what you find with your doctor. Viewed as a trend, your results may help you notice changes earlier and decide what to do next with professional guidance.
Frequently asked questions:
What are the most important biomarkers for longevity?
The best-studied ones are blood pressure, cholesterol markers such as ApoB and LDL-C, HbA1c, waist measurement, cardiorespiratory fitness and grip strength. Your doctor can tell you which matter most for you.
Can a biomarker predict how long I will live?
No. Biomarkers show risk and direction, not lifespan. Many can be changed, which is why following them over time is useful.
How often should I test?
It depends on the marker, your age and your history, so follow your doctor’s advice. Fitness and strength measures can be repeated every few months.
Are biological age tests worth it?
They are interesting, but they are not established for routine health decisions and rarely tell you what to do next. Your time is better spent on the markers above.

Author
Mia Dimitrova
Junior Marketing Executive at Veraia
Hi, I'm Mia, Junior Marketing Executive at Veraia - your personal AI health assistant. Always curious about life and passionate about all things health, psychology and storytelling. You can often find me with a dog, a ukulele or staring at the stars.